Global Health
Report (Layout, Infographics, Graphs)

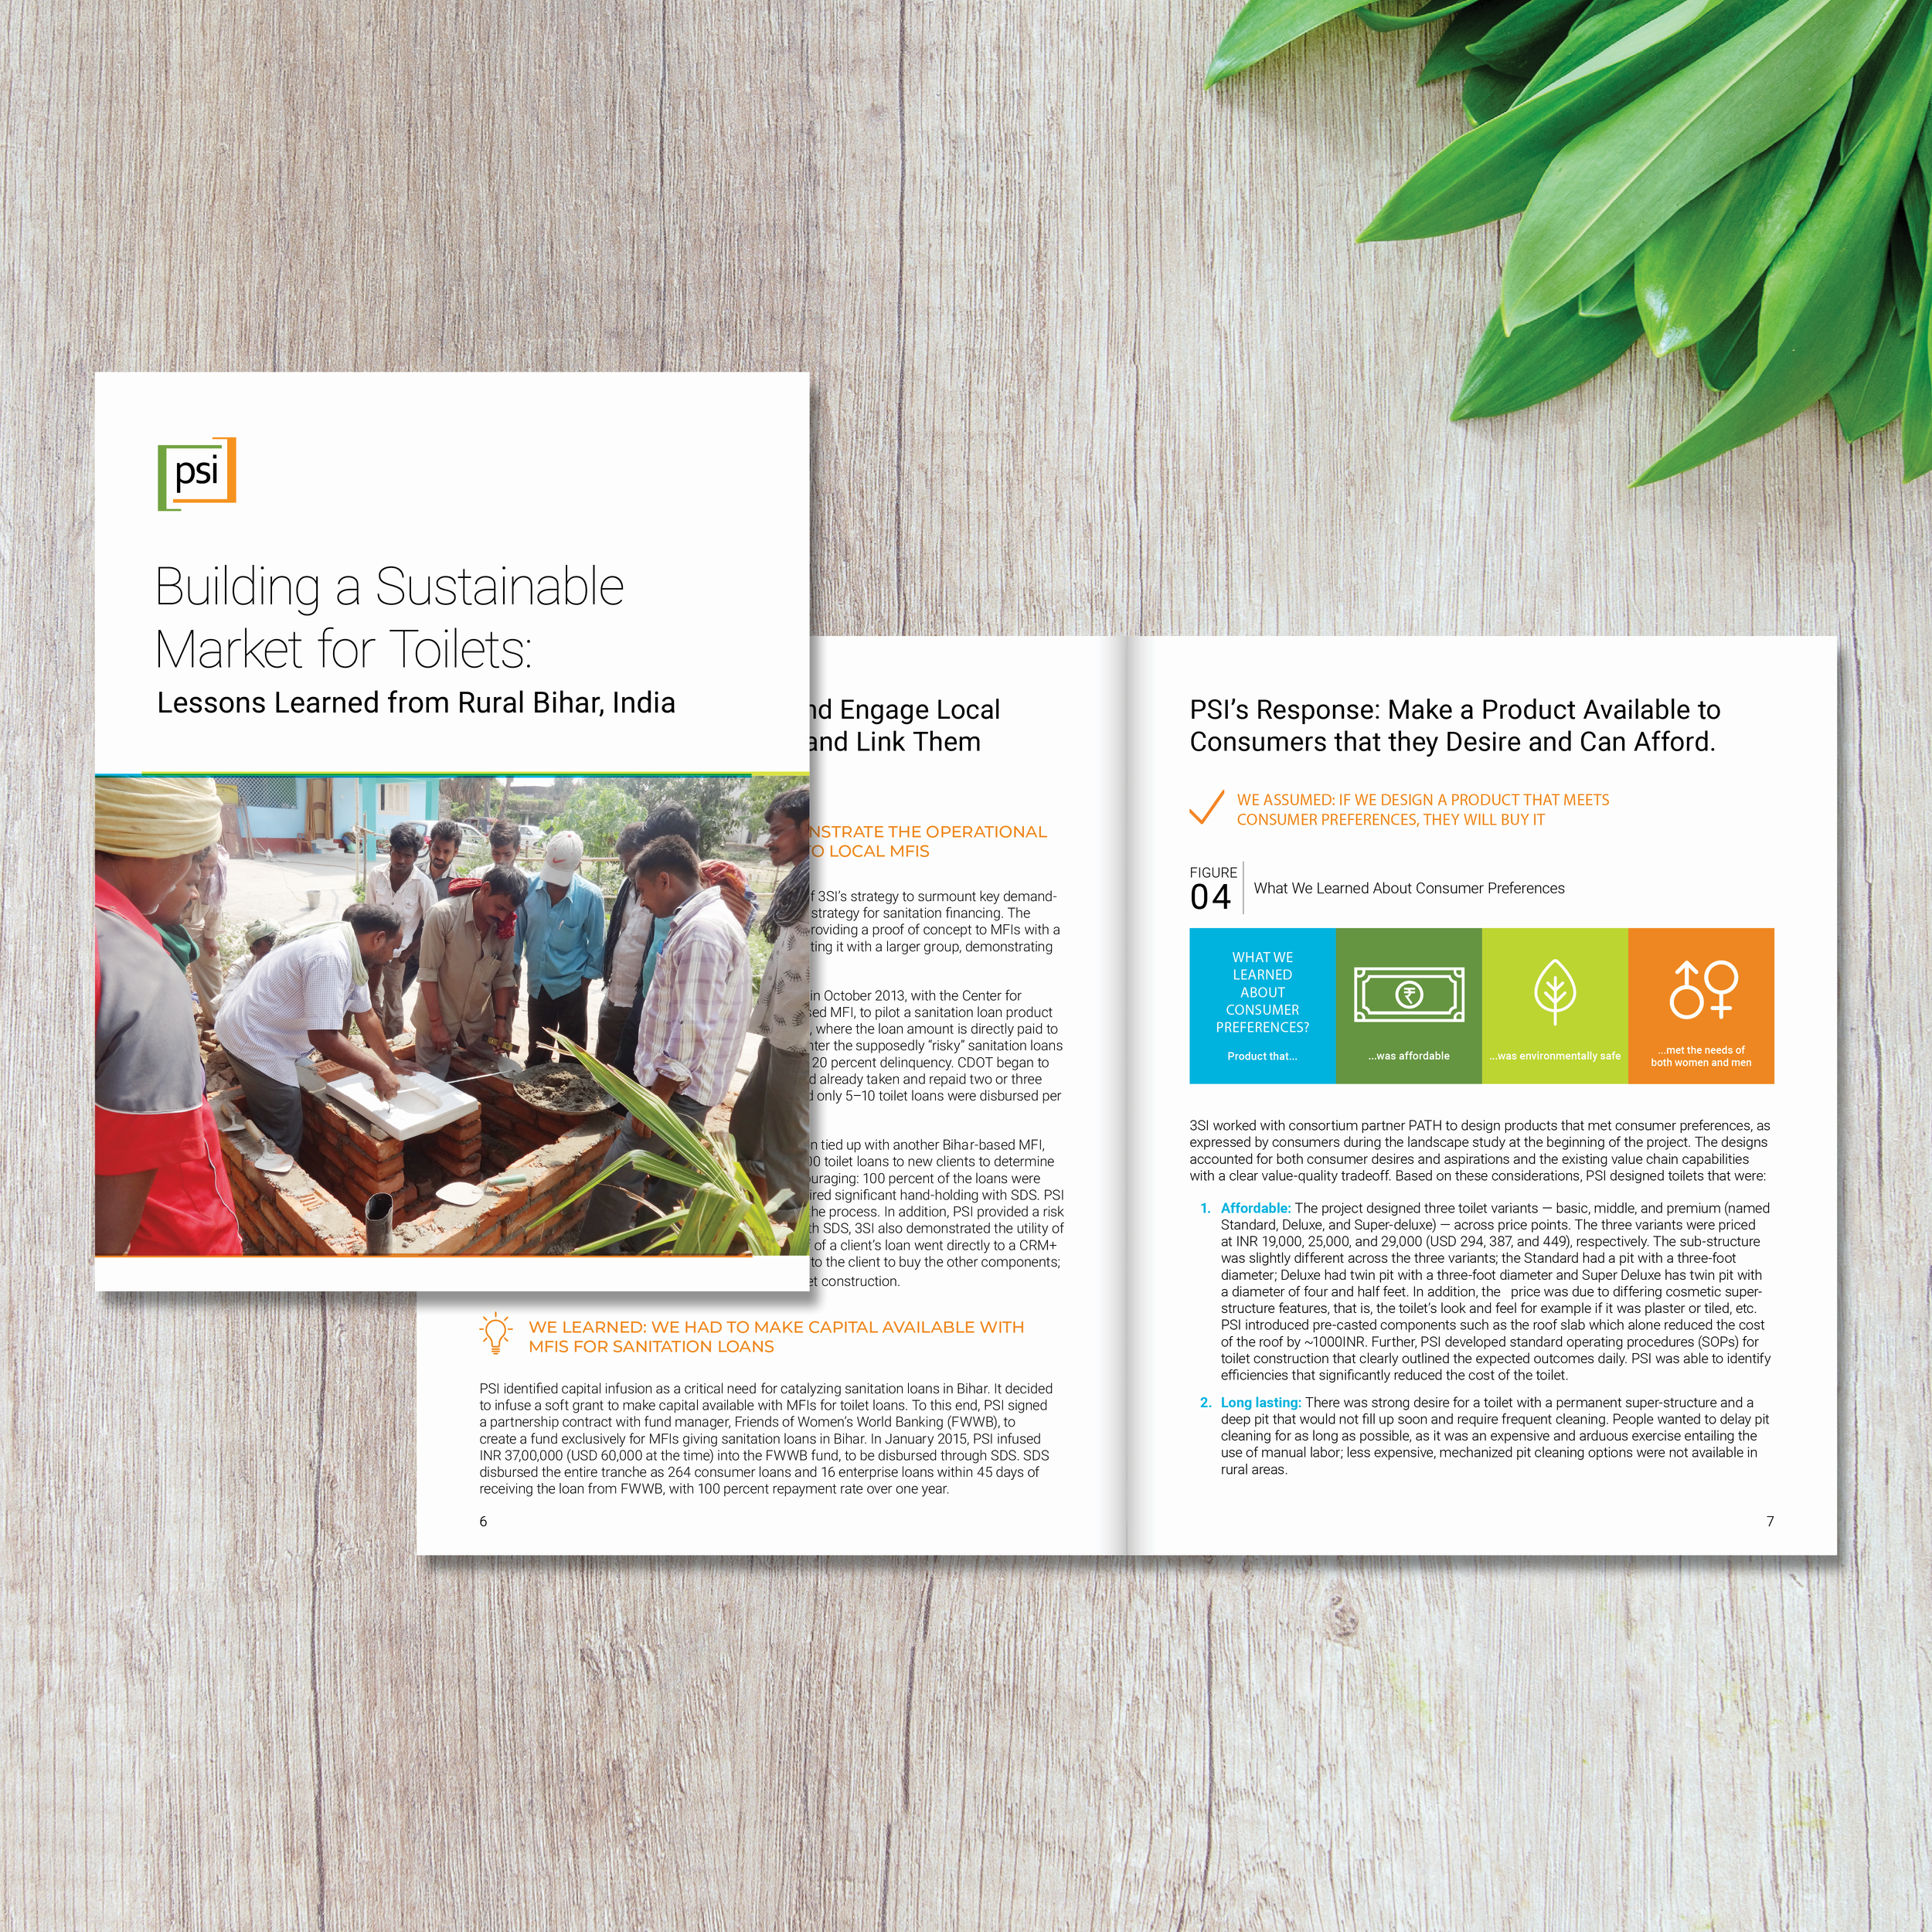
Population Services International is a nonprofit that does incredible work to improve health around the world. It was so wonderful to work with them and be part of their mission. They were interested in creating a printed booklet-style report to summarize all of the lessons learned from one of their multi-year sanitation projects in India.
We designed a report that aligns with their bright and colorful brand and highlights stunning photos of the people affected by the work. We used pops of color and icons throughout the report to help make it easier to read.


We created several infographics to drive home some of the key information shared in the report. Using visuals to communicate this information makes it stand out more and makes it more memorable compared to a standard block of text.


The project also yielded a lot of quantitative data that the client wanted to share in the report. To do so, we designed several charts and graphs for the report, such as bar charts and line graphs, so this data would visually pop and be easy to comprehend.


Role
Graphic designer.
Brainstormed and sketched ideas for layout and infographics
Created template layout; populated with copy and selected photos from client
Designed data visualization elements, including infographics, charts, and graphs
Incorporated updates from client and ensured alignment with brand
Programs Used
Adobe InDesign
Adobe Illustrator
Adobe Photoshop
Client
Population Services International